
CLIMATE PATHWAYS RANKING 2026
September 23, 2026
For the fifth consecutive year, Les Ateliers du Futur has scrutinised the climate pathways of France’s 40 largest listed companies, based on their Universal Registration Documents for the 2025 financial year.
In summary:
- Only 9 companies out of 40 achieve a score of at least 7/10, indicating a decarbonisation pathway that is both credible and sufficiently ambitious.
- Only around 40% of CAC 40 companies are reducing their emissions by at least 4.2% per year, the pace required for a 1.5°C-aligned trajectory.
- Performance depends more on the choices made by individual companies than on the sectors in which they operate. Average sector scores range from 3.5 (automotive and aerospace) and 3.9 (energy and utilities) to 5.5 (construction and real estate) and 5.7(services). However, the luxury sector includes one major improvement (LVMH) alongside two declines (Hermès and Kering), while the construction sector features both a notable improvement (Bouygues) and a decline (Saint-Gobain).
- Finally, the companies that improved are those that addressed the issues highlighted in our recommendations last year, namely SBTi validation across all three scopes, publication of a Dancing Box, and quantified transition financing. The recommendations therefore make a tangible difference when senior management takes ownership of them.
This article presents the overall results. Our forthcoming articles will explore best practices in greater depth and provide sector-by-sector analyses.
1. The Climate Emergency and the Decisive Role of Businesses
The scientific consensus has not changed, but the time available to act is shrinking. The IPCC (AR6) has established that limiting global warming to 1.5°C requires a reduction in global CO₂ emissions of around 43% between 2019 and 2030, followed by the achievement of net zero around 2050. Yet global emissions have not yet begun to decline: according to the Global Carbon Budget 2025, fossil CO₂ emissions reached a new record in 2025, at 38.1 billion tonnes (+1.1%).
Against this backdrop, large corporations occupy a unique position. They combine the three essential conditions for action:
- the ability to act (capital and investment capacity),
- the expertise to act (technologies, engineering capabilities and supply chains),
- and, when they choose to exercise it, the willingness to act.
Taken together with their value chains, the 40 CAC 40 companies account for emissions equivalent to roughly six times France’s territorial emissions (1). The investment decisions they make between now and 2030 will shape actual emissions trajectories far beyond that date: a power plant, a factory, a vehicle platform or a lending portfolio typically locks in emissions for fifteen to thirty years.
This is why the Ranking does not measure a company’s current level of emissions, but rather the ambition and credibility of its transition pathway. Does it have:
- 2030 targets aligned with the Paris Agreement?
- An action plan whose levers are sufficient to deliver those targets?
- Clearly identified financing?
- A formalised 2050 pathway?
- And senior management that genuinely oversees the whole process?
A highly emitting company may therefore rank above a low-emitting one, if and only if its transformation is underway, properly financed and effectively governed.
2. The 2026 Results
Key Figures
9 groups out of 40 achieved a score of 7/10 or higher, the threshold for what is considered a « credible » 2030 pathway (14 in 2025, based on a comparable sample of 38 groups). Under an unchanged methodology, 15 groups would have exceeded this threshold. The difference reflects the deliberate tightening of our scoring methodology.
Only five groups have a « complete » 2030 strategy: absolute targets across all three scopes (6/6), an action plan whose impacts fully cover the target, and quantified financing (at least 4/6 on each dimension). These companies are Engie, Orange, Unibail-Rodamco-Westfield, Bouygues and Renault.
Financing remains a weak link: only 15 of the 36 non-financial groups provide forward-looking estimates of the CAPEX/OPEX required for their 2030 transition plans. For the remaining 21, targets are not supported by clearly identifiable funding.
Executive oversight is weakening: this is the dimension showing the largest decline (17 groups out of 38), following the clarification of assessment criteria in 2026. Operational monitoring by senior management is slipping behind.
The automotive and aerospace sectors are moving backwards on targets: Stellantis (9.5 → 2.8) still maintains absolute-value 2030 targets but now explicitly states that they are not aligned with a 1.5°C pathway; Safran (6.2 → 2) and Airbus (4.7 → 1) no longer manage their Scope 3 emissions, representing 94% and 99% of their respective footprints, except through intensity-based targets and on a 2035 timeframe.
Notable improvements include LVMH (5.2 → 7.5), Engie (8 → 9.5), Orange (7.5 → 8.5), as well as Bouygues, Pernod Ricard and Legrand (+0.5 each).
Compared with 2025: among the 38 comparable groups, 8 improved, 27 declined and 3 remained stable. Under the unchanged 2025 formula, the outcome would have been 16 increases, 16 decreases and 6 stable scores. The new overall weighting system explains most of the moderate declines, whereas the more pronounced drops (Stellantis, Airbus, Schneider Electric, Sanofi, Safran, Accor, Hermès, Dassault Systèmes and Saint-Gobain) reflect deterioration in the underlying dimension scores themselves.
Ranking of Non-Financial Groups
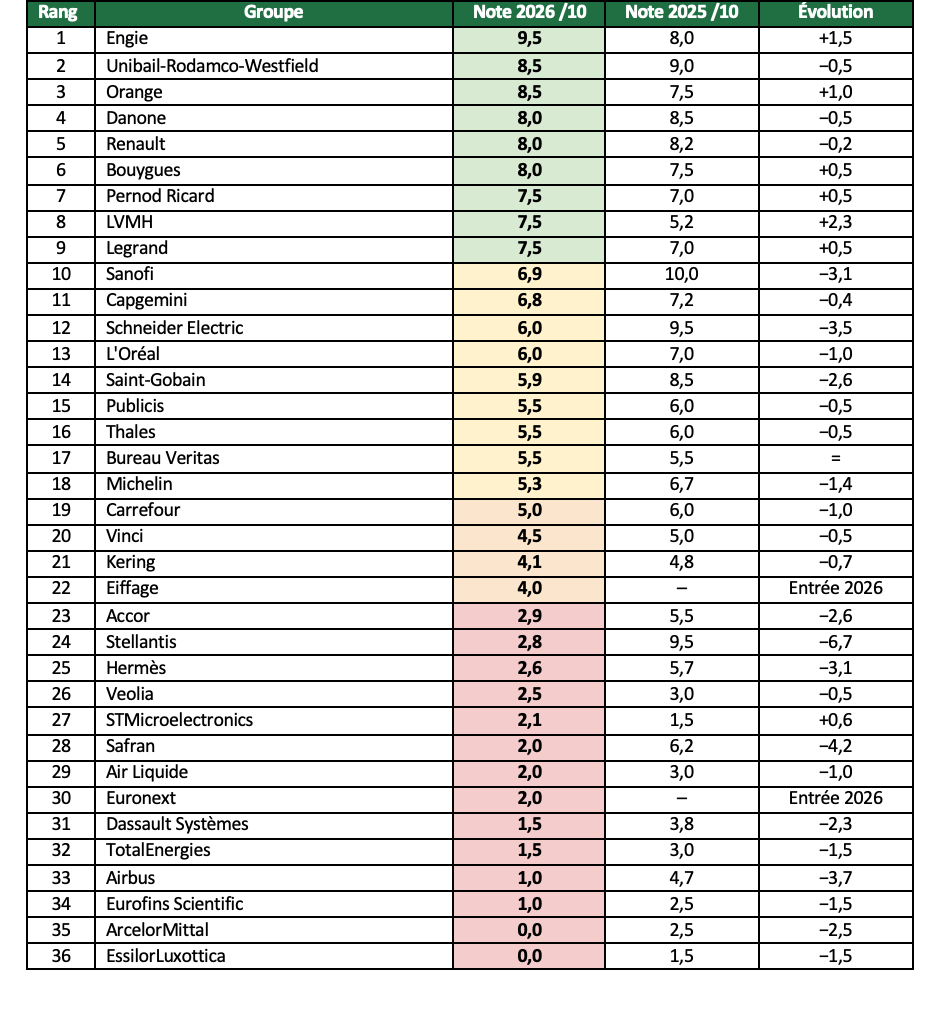
Reading guide:
Green: ≥ 7 (Satisfactory) · Yellow: 5.1 to 6.9 (Needs Improvement) · Orange: 3.1 to 5 (Insufficient) · Red: 0 to 3 (Highly Insufficient).
The 2025 score was calculated using the 2025 linear formula, while the 2026 score uses the new 2026 modulated formula (see Section 3).
Eiffage and Euronext, which joined the CAC 40 in 2025, have no year-on-year comparison. Teleperformance, Edenred and Alstom have been removed from the assessment perimeter.
Ranking of Banks and Insurers
The four financial institutions are assessed using a dedicated framework focused on financed emissions and based on four dimensions, as the financing criterion does not apply to them.
None achieves a score of 7/10.
BNP Paribas and Société Générale are tied on 6/10 (Needs Improvement), while Crédit Agricole (4.9) and AXA (4.4) are rated « Insufficient ».
The common constraint lies in their 2030 targets: targets remain predominantly intensity-based, only part of their loan and investment portfolios is covered, and no financial institution has yet obtained SBTi validation for its targets.
More broadly, the financial sector continues to exhibit significant disclosure gaps, particularly regarding facilitated, managed and insured emissions, whereas the CSRD has substantially improved transparency among non-financial companies.

3. Methodology and Tightening of the 2026 Assessment Framework
Five Dimensions, Scored from 0 to 6
Each group is assessed on the basis of its regulatory disclosures (Universal Registration Documents and CSRD/ESRS E1 sustainability statements), using a framework of objective questions. Supporting extracts are retained together with their original page references. Before publication, the results are submitted to each group through an adversarial review process. The framework assesses both the destination(2030 and 2050 targets) and the journey (action plan, financing and governance).
D1 – 2030 Targets
6/6: Absolute emissions reduction targets covering 100% of Scopes 1 and 2 and at least 80% of Scope 3 emissions, validated by the SBTi or, failing that, aligned with an IEA sector benchmark or the cross-sector benchmark (-42% by 2030 versus 2019).
4/6: Same requirements, but targets expressed in emissions intensity.
2/6: Targets defined except for downstream Scope 3 emissions.
D2 – 2030 Action Plan
6/6: Published decarbonisation levers with quantified impacts covering at least two-thirds of emissions, quantified consistency between the sum of the levers’ impacts and the target (the « Dancing Box »), and demonstrated effectiveness through an absolute emissions reduction of at least 4.2% per year since the baseline year.
4/6: Same requirements, but without a Dancing Box.
2/6: Decarbonisation levers published, but effectiveness not yet demonstrated.
D3 – 2030 Financing
6/6: CAPEX (industry) or OPEX (services) quantified through to 2030 for measures accounting for at least 66% of the action plan’s impact, and sustainable in light of expected cash flows.
4/6: Only the main expenditure items are quantified.
2/6: Not quantified, but the financial requirement appears immaterial.
0/6: Not quantified despite being financially significant.
Not applicable to banks and insurers.
D4 – 2050 Pathway
6/6: A formally adopted Net Zero commitment, identified transition levers, alignment confirmed by the SBTi or an IEA sector pathway, no reliance on immature technologies (or a quantified deployment plan by 2030), and residual offsetting in 2050 limited to 10% or less of baseline emissions.
4/6: Reliance on immature technologies without a detailed deployment plan.
2/6: Residual offsetting exceeds 10%.
D5 – Executive Governance
6/6: Oversight at CEO, Deputy CEO or equivalent level, supported by a dedicated Climate or Sustainability Committee, or regular and documented monitoring, at least quarterly, at Executive Committee level.
4/6: Executive Committee member with a dedicated committee, or CEO oversight without a dedicated committee.
2/6: Executive Committee member responsible, but without a dedicated committee or regular monitoring.
0/6: Oversight delegated below Executive Committee level.
For banks and insurers, D1 and D2 focus on financed emissions (sector targets and engagement policies for the highest-emitting sectors), while D4 assesses the Net Zero 2050 commitment against a recognised pathway (IEA NZE) and membership of the remaining sector-specific Net Zero alliances (NZAOA, NZAM), following the cessation of activities of the Net-Zero Banking Alliance in October 2025.
Tightening of the Framework for the 2026 Edition
The 2026 framework, applied to 2025 disclosures, retains the structure of previous editions but strengthens several criteria. These changes account for part of the decline in scores and are deliberate: with only four years remaining until 2030, setting targets is no longer enough; companies must demonstrate how they intend to achieve them.
Quantified Scope 3 Coverage
The two highest levels of D1 now require targets covering at least 80% of Scope 3 emissions, upstream and downstream combined. The previous framework merely required Scope 3 targets to be defined.
Mandatory Dancing Box for a 6/6 Action Plan Score
The consistency between targets and decarbonisation levers must now be demonstrated quantitatively: the 2030 target must be equal to the sum of the reductions delivered by the various levers. A detailed plan without such a demonstration is capped at 4/6.
Demonstrated Effectiveness at -4.2% per Year
Actual reductions in absolute emissions since the baseline year now form part of the credibility assessment. The threshold is -4.2% per year, the pace required by the SBTi’s cross-sector 1.5°C pathway. Groups whose emissions increase in line with business growth must therefore decarbonise their growth as well.
Financing: A Coverage Threshold
Achieving 6/6 in D3 now requires quantified financing covering measures responsible for at least 66% of the action plan’s impact, rather than a partial estimate.
2050 Pathways: Immature Technologies and Offsetting
A pathway relying on immature technologies (CCS, hydrogen, DAC) without a quantified deployment plan by 2030 is capped at 4/6. Residual offsetting is capped at 10% of baseline emissions, in line with the SBTi Net-Zero Standard.
Governance: Clarified Criteria
A score of 6/6 requires oversight at senior executive level, supported by a dedicated committee, or regular and documented monitoring directly by the Executive Committee. The requirement itself is not new, but its assessment has become systematic, which explains the decline observed for 17 groups on this dimension.
Weighting Modulated by 2030 Targets
This is the most significant change and is explained below: the action plan and its financing receive their full weight only if the company’s 2030 targets are robust.
Calculation of the Final Score
Until 2025, the overall score was a linear weighted average of the five dimensions:
- 40% for 2030 targets;
- 15% for each of the four remaining dimensions.
The weakness of this approach was that a company could achieve a strong overall score thanks to a well-documented action plan and financing strategy, even though its 2030 targets were not aligned with the Paris Agreement: in other words, a credible plan for reaching the wrong destination.
The 2026 formula makes the weight of the action plan (D2) and financing (D3) conditional upon the robustness of the targets (D1), through a modulation coefficient equal to (D1/6)^0.3.
Overall Score /6 =
0.25 × D1 + (0.30 × D2 + 0.15 × D3) × (D1 / 6)^0.3 + 0.15 × D4 + 0.15 × D5
Overall Score /10 =
Overall Score /6 × 10 / 6
For banks and insurers, D3 does not exist. Its weighting is transferred to the action-plan dimension, such that:
(0.30 + 0.15) × D2 = 0.45 × D2
within the modulated term, while D1, D4 and D5 retain their original coefficients.
The modulation coefficient is:
- 1.00 when D1 = 6
- 0.89 when D1 = 4
- 0.72 when D1 = 2
- 0.00 when D1 = 0
In other words, a group without an admissible 2030 target receives no credit from either its action plan or its financing. A group with only partially adequate targets receives reduced credit for both.
Two examples illustrate the formula:
Engie
(D1 = 6, D2 = 6, D3 = 6, D4 = 4, D5 = 6)
0.25 × 6 + (0.30 × 6 + 0.15 × 6) × 1 + 0.15 × 4 + 0.15 × 6
= 1.5 + 2.7 + 0.6 + 0.9
= 5.7/6, equivalent to 9.5/10
Sanofi
(D1 = 4, D2 = 2, D3 = 6, D4 = 6, D5 = 6)
0.25 × 4 + (0.30 × 2 + 0.15 × 6) × 0.885 + 0.15 × 6 + 0.15 × 6
= 1.0 + 1.33 + 0.9 + 0.9
= 4.13/6, equivalent to 6.9/10
Using the 2025 linear formula, the same dimension scores would have produced 7.7/10. The difference is entirely attributable to the Scope 3 target, which is aligned with a 2°C pathway rather than a 1.5°C pathway, reducing D1 to 4 and consequently reducing the weight of both the action plan and financing dimensions.
The 2025 and 2026 scores are therefore not strictly comparable, even where underlying dimension scores are identical.
4. Focus on the Top 9: Best Practices
The nine groups rated « Satisfactory » are not flawless. None achieves a perfect 6/6 across all five dimensions. However, each illustrates, through three or four dimensions, what a credible climate pathway means in practical terms. Scores are presented in the order D1 · D2 · D3 · D4 · D5.
Engie — 9.5/10
Energy · Dimension scores: 6 · 6 · 6 · 4 · 6
Ranked first overall, Engie exemplifies what the Ranking seeks to measure: not current emissions levels, but commitment to a transformation that is both financed and effectively governed. The group achieves the maximum score on four dimensions.
2030 targets (6/6). SBTi-certified 2030 targets aligned with a Well-Below 2°C pathway, expressed in carbon intensity terms (-66% for energy generation and -56% for energy sales versus 2017), as prescribed by the SBTi methodology for the power sector. These are complemented by an absolute emissions cap covering 100% of Scopes 1, 2 and 3, including downstream emissions: 120-140 MtCO₂e in 2030, compared with 265 Mt in 2017 and 145 Mt in 2025. The reduction trajectory is consistent with the cross-sector 1.5°C benchmark (-4.2% per year).
Action plan (6/6). Five major transformation levers (coal phase-out by 2027, 95 GW of renewables by 2030, biomethane, hydrogen and customer support programmes) supported by a quantified breakdown of impacts through to 2030 (« Dancing Box ») and an actual reduction of 45% between 2017 and 2025, equivalent to approximately 7% per year.
Financing (6/6). €4 billion of CAPEX allocated to the plan in 2025 and €25-28 billion of growth CAPEX planned for 2026-2028, 84% aligned with the EU Taxonomy and supported by EBITDA of around €15 billion per year. Every investment decision is subject to a dedicated CO₂ budget by business activity.
Governance (6/6). Oversight is provided by the Chief Executive Officer and the Deputy CEO for Finance and ESG, with management reviews of greenhouse-gas indicators incorporated into Quarterly Business Reviews since 2023. The only area of concern relates to the 2050 pathway (4/6): Net Zero by 2045 has been formally adopted, but the 2035 and 2040 milestones for electricity generation remain above the IEA Net Zero Emissions (NZE) scenario.
Unibail-Rodamco-Westfield — 8.5/10
Real Estate · Dimension scores: 6 · 4 · 4 · 6 · 6
In a property sector where asset use dominates the carbon footprint, URW remains on the podium with maximum scores on three dimensions.
2030 targets (6/6). A 90% reduction in Scopes 1 and 2 emissions and a 50% reduction in Scope 3 emissions by 2030 versus 2015, validated by the SBTi as aligned with a 1.5°C pathway, across 100% of the group’s perimeter.
Action plan (4/6). Decarbonisation levers and quantified impacts are disclosed across all three scopes, with a robust Dancing Box for Scopes 1 and 2. Total emissions have fallen by 42.7% between 2015 and 2025 (approximately 5.4% per year). However, a consolidated Dancing Box is still missing for Scope 3 emissions, of which visitor transport accounts for 82%.
2050 pathway (6/6). Net Zero 2050 target validated under the SBTi Net-Zero Standard (2023 revision): 90% absolute emissions reduction, no dependence on speculative technologies, and residual offsetting limited to 10%.
Governance (6/6). Oversight is led by a member of the Management Board reporting directly to the Chairman. The Management Board and Executive Committee jointly act as the Sustainability Steering Committee, with documented quarterly reviews.
Orange — 8.5/10
Telecommunications · Dimension scores: 6 · 6 · 4 · 6 · 2
Orange gains one full point and demonstrates that a service-sector company can successfully complete its Dancing Box and provide quantified financing.
2030 targets (6/6). A 45% reduction across all three scopes by 2030 versus 2020 (from 6.5 to 3.6 MtCO₂e), expressed in absolute terms and validated by the SBTi as 1.5°C-aligned in May 2024, covering 100% of Scopes 1 and 2 as well as Scope 3.
Action plan (6/6). Quantified levers across all three scopes (energy, suppliers, circular economy and electricity mix), supported by a complete waterfall analysis. Emissions have already fallen by 24.5% between 2020 and 2025, equivalent to 5.5% per year.
Financing (4/6). Annual CAPEX and OPEX of €300-400 million dedicated to energy efficiency and renewable energy between 2025 and 2030. The investment is considered affordable, although the quantification does not yet cover all decarbonisation levers.
2050 pathway (6/6). Net Zero by 2040, formally adopted and validated under the SBTi Net-Zero Long-Term Standard in May 2024. The pathway does not rely on immature technologies and limits the contribution of natural carbon removals to 10%. The main area for improvement is governance (2/6): the Chief Sustainability Officer sits on the Executive Committee, but climate issues are discussed there only three times per year.
Danone — 8/10
Food & Beverage · Dimension scores: 6 · 6 · 0 · 6 · 4
Danone remains the leading company in the food sector, with three dimensions achieving full marks. Its weakness is clear: no financial quantification of the 2030 transition plan (0/6), despite the material nature of the challenge.
2030 targets (6/6). A 46.3% reduction in Scopes 1 and 2 emissions, a 42% reduction in non-FLAG Scope 3 emissions, and a 30.3% reduction in FLAG emissions (agriculture and forestry) between 2020 and 2030, all expressed in absolute terms and validated by the SBTi across all three scopes.
Action plan (6/6). A Climate Transition Plan published as early as December 2023 and structured around eight quantified programmes covering all scopes, including the « Re-Fuel » initiative for industrial sites and regenerative agriculture across the dairy value chain. The plan includes a clear Dancing Box. Emissions fell by 21% between 2020 and 2025 (approximately 4.7% annually), and 60.5% of the 2030 target had already been achieved by the end of 2025.
2050 pathway (6/6). Net Zero by 2050, formally adopted and validated by the SBTi at the 1.5°C level. Identified action levers are structured programme by programme and rely primarily on mature technologies. The robustness of the residual offsetting strategy remains to be demonstrated.
Governance (4/6). Climate resources are overseen by the Deputy CEO for Finance, Technology and Data; a Chief Sustainability Officer sits on the Executive Committee; and a dedicated Global Impact Committee is co-chaired by three Executive Committee members. However, there is no direct CEO-level oversight or documented quarterly Executive Committee review.
Renault — 8/10
Automotive · Dimension scores: 6 · 4 · 4 · 4 · 6
Against the backdrop of a sharply declining automotive sector, Renault maintains a complete 2030 strategy overseen at the highest level.
2030 targets (6/6). A 62.5% reduction in Scopes 1 and 2 emissions and a 27.5% reduction in Scope 3 emissions by 2030 compared with 2019, expressed in absolute terms and validated by the SBTi (2025 review), with 100% Scope 3 coverage.
Action plan (4/6). An effective transition plan, supported by a 38% absolute reduction in emissions between 2019 and 2025, equivalent to a compound annual reduction of 7.7%. However, the contribution of each lever is not disclosed: without a Dancing Box, the score is capped at 4/6.
Financing (4/6). The principal CAPEX and OPEX components of the transition plan are quantified in the Universal Registration Document, including roughly €1.5 billion per year for electric vehicles and additional spending on decarbonised procurement. These investments are affordable relative to turnover (€57.9 billion), but a full breakdown by lever is not provided.
Governance (6/6). Quarterly Executive Committee reviews of an ESG dashboard, a biannual « Decarbonisation Control Tower », and a Sustainability function reporting to the Chief Strategy Officer, who sits on the Executive Committee. The 2050 pathway (4/6), targeting Net Zero in Europe by 2040 and globally by 2050, relies partly on immature technologies such as CCS and hydrogen without a quantified deployment plan to 2030.
Bouygues — 8/10
Construction · Dimension scores: 6 · 6 · 4 · 0 · 6
Bouygues gains half a point and joins the five companies with a « complete » 2030 strategy. Its case also illustrates the limits of the assessment: Net Zero 2050 is publicly stated, but without long-term SBTi validation or demonstrated alignment with the IEA NZE scenario, resulting in a score of 0/6 for the 2050 pathway.
2030 targets (6/6). SBTi-validated targets for each of the group’s six business divisions, expressed in absolute terms across all three scopes, with Scope 3 also expressed in intensity terms for Bouygues Construction and Equans.
Action plan (6/6). Published waterfall analyses for Scopes 1 and 2 on the one hand and Scope 3 on the other. Total emissions were reduced to 19.4 MtCO₂e in 2025, representing a 7% decrease in one year and an annual reduction of 4.9% in Scope 3 emissions since the 2021 baseline.
Financing (4/6). Aggregated climate CAPEX/OPEX of €54 million in 2025 and €271 million cumulatively between 2026 and 2028, although no breakdown by lever is provided.
Governance (6/6). The Deputy Chief Executive in charge of CSR issues annual sustainability guidance to the business divisions, whose plans are reviewed by senior management. The Deputy CEO for Innovation and Sustainable Development sits on the Group Executive Committee, and an Environment Committee meets quarterly.
Pernod Ricard — 7.5/10
Spirits · Dimension scores: 6 · 6 · 0 · 6 · 2
Pernod Ricard gains half a point thanks to an action plan whose consistency with its targets was recognised during the adversarial review process. Like Danone, the group does not provide quantified financing for its transition plan (0/6).
2030 targets (6/6). SBTi-validated targets adopted in 2024 for FY2029/30, expressed in absolute terms and by emissions perimeter: -54% for non-FLAG Scopes 1 and 2 emissions, -30.3% for FLAG emissions, and -25% for non-FLAG Scope 3 emissions. Scope 3 coverage reaches 85%.
Action plan (6/6). Detailed decarbonisation levers with quantified impacts by scope, including mechanical vapour recompression, heat pumps, renewable electricity through PPAs, regenerative agriculture and circular packaging. The sum of these impacts is consistent with the stated targets (Dancing Box), and emissions have demonstrably declined by approximately 4.7% per year since FY2021/22 (-13.5% overall and -42% across Scopes 1 and 2), exceeding the required threshold of 4.2% annually.
2050 pathway (6/6). Net Zero formally adopted and validated by the SBTi in 2024 (-90% for Scopes 1 and 2, -72% for FLAG emissions and -90% for non-FLAG Scope 3 emissions by 2050). The principal levers have been identified, including energy efficiency, electrification, renewable energy and regenerative agriculture. Carbon credits are explicitly presented as non-core to the strategy.
Governance (2/6). Operational oversight is led by the Executive VP for Integrated Operations and Sustainability, who sits on the Executive Committee. However, there is no dedicated Climate Committee and climate matters are reviewed by the Executive Committee only twice a year.
LVMH — 7.5/10
Luxury Goods · Dimension scores: 6 · 6 · 2 · 4 · 2
Recording the strongest improvement in the Ranking (+2.3 points), LVMH addressed the recommendations made in 2025 point by point, notably through SBTi validation across all three scopes and the publication of a quantified transition plan.
2030 targets (6/6). Absolute emissions reduction targets validated by the SBTi in December 2024 across all three scopes: -68% for Scopes 1 and 2, -27% for FLAG emissions and -23% for energy and industrial emissions between 2023 and 2030.
Action plan (6/6). A comprehensive, quantified and already proven action plan, with absolute emissions impacts identified for each lever, including energy efficiency and conservation measures, renewable energy, a shift from air freight to maritime and rail transport, supplier engagement and regenerative agriculture. These measures are presented through a complete Dancing Box. Total emissions fell by 12%, and Scopes 1 and 2 emissions by 37%, between 2023 and 2025.
2050 pathway (4/6). Net Zero 2050 has been formally adopted and validated by the SBTi. The pathway is built around the renovation and optimisation of existing assets, sustainable transport and sustainable agriculture. However, the planned use of immature technologies and the level of residual offsetting envisaged for 2050 remain insufficiently specified, resulting in a score of 4/6.
Areas for improvement.
Financing (2/6). Between €235 million and €270 million of cumulative CAPEX and OPEX through to 2030 have been quantified for Scopes 1 and 2, but no equivalent estimates have been disclosed for Scope 3 emissions, which are currently viewed as having limited financial implications. A Sustainable Finance taskforce is expected to report by the end of 2026.
Governance (2/6). Responsibility for environmental issues sits within the Image & Environment department reporting to an Executive Committee member, but there is no dedicated executive Climate Committee and no documented climate reviews at Executive Management Committee level.
Legrand — 7.5/10
Electrical Equipment · Dimension scores: 6 · 2 · 4 · 6 · 6
Legrand gains half a point, supported by newly disclosed financial estimates and exemplary governance arrangements. The effectiveness of its action plan remains to be demonstrated (2/6): emissions across all three scopes increased by 22% between 2022 and 2025, driven by a 23% increase in Scope 3 emissions.
2030 targets (6/6). A 42% reduction in Scopes 1 and 2 emissions and a 25% reduction in Scope 3 Categories 1 and 11 (representing approximately 94% of the group’s total footprint) by 2030, using 2022 as the baseline year. These absolute targets were validated by the SBTi in 2024 (1.5°C alignment for Scopes 1 and 2 and Well-Below 2°C alignment for Scope 3).
Financing (4/6). The transition plan includes quantified investments of €104.5 million in CAPEX and €434.2 million in OPEX as of 2025, considered affordable in light of annual free cash flow of approximately €1.3 billion. However, the allocation of expenditure by individual decarbonisation lever has not yet been finalised.
2050 pathway (6/6). Net Zero 2050 was formally adopted in 2024 and validated under the SBTi Net-Zero Standard. The pathway targets a 90% reduction across Scopes 1, 2 and 3, with residual emissions neutralisation capped at 10%. The strategy relies on available technologies, including electrification, RE100 by 2030 and eco-design, without dependence on immature solutions.
Governance (6/6). A dedicated Carbon Committee, chaired by senior management and composed of five members of the Executive Committee, oversees delivery of the climate strategy.
Looking ahead
What these nine groups demonstrate is that the requirements of the framework are achievable across all sectors, including both the most emissions-intensive industries and the most service-oriented businesses.
A credible pathway requires
- SBTi-validated absolute targets covering at least 80% of Scope 3 emissions,
- a Dancing Box linking each decarbonisation lever to the overall target,
- quantified transition CAPEX and OPEX,
- a 2050 pathway that does not rely on unavailable technologies,
- and senior management oversight on a quarterly basis.
Most of the remaining 31 groups possess one or two of these elements; what they lack is the complete package.
As 2030 approaches, it may be tempting to change the thermometer rather than treat the fever: postponing targets to 2035, switching from absolute emissions reductions to intensity-based metrics, or narrowing the reporting perimeter. The Ranking will continue to identify and highlight such practices.
WE CALL ON ALL COMPANIES TO CONTINUOUSLY IMPROVE THE QUALITY OF THEIR CLIMATE PATHWAYS ACROSS THEIR ENTIRE VALUE CHAIN BY ADOPTING THE BEST PRACTICES OF THEIR PEERS.
Our contribution towards this objective includes:
- The recommendations we have already issued at overall, sectoral and individual company level;
- Our forthcoming articles on best practices in relation to 2030 targets and transition action plans. The practices implemented by Bouygues, Danone, Engie, LVMH, Orange and Pernod Ricard are already available on our blog.
Sources
2025 Universal Registration Documents of the 40 CAC 40 groups; Les Ateliers du Futur 2026 scoring framework (non-financial groups and financial institutions); IPCC AR6 (2022-2023); Global Carbon Budget 2025 (Global Carbon Project, November 2025); Copernicus C3S, Global Climate Highlights 2025. The scores cited are those finalised following the adversarial review process with the groups concerned.
(1) Global 2025 Emissions of the 36 Non-Financial CAC 40 Groups
(Scopes 1 + 2 market-based + Scope 3, MtCO₂e)
| Scope | MtCO₂e |
|---|---|
| Scopes 1 + 2 | 247 |
| Scope 3 | 2,072 |
| Total | 2,319 |
France’s Territorial Emissions
(Citepa, Secten)
- 367 MtCO₂e in 2024
- 359 MtCO₂e (provisional estimate) in 2025, excluding carbon sinks
Source: Les Ateliers du Futur.